Fast-Turnoff Transient Electro-Magnetic (TEM) Geophysical Survey
Rio Tinto,
May 27 – June 6, 2003
A small contribution to the MARTE project
Report / summary, August 4, 2003
Fast-Turnoff Transient Electro-Magnetic (TEM) Geophysical Survey
Rio Tinto,
May 27 – June 6, 2003
A small contribution to the MARTE project
Report / summary, August 4, 2003
Table of Contents
General Description of the Field Area
Electromagnetic
Methods for Mapping Subsurface Conductive Fluids
Electromagnetic
Method Chosen for this Field Survey
Summary and Recommendations. 28
Appendix A: Line 1 Smooth-Model Data. 33
Appendix B: Line 2 Smooth-Model Data. 36
Appendix C: Line 3 Smooth-Model Data. 40
Appendix D: Line 4 Smooth-Model Data. 43
Appendix E: Line 5 Smooth-Model Data. 48
Appendix F: Line 6 Smooth-Model Data. 52
Appendix G: Line 7 Smooth-Model Data. 54
Appendix H: Line 8 Smooth-Model Data. 56
Appendix I: Line 9 Smooth-Model Data. 58
Appendix J: Line 10 Smooth-Model Data. 62
Appendix K: Line 11 Smooth-Model Data. 63
Appendix L: Line 12 Smooth-Model Data. 65
Appendix M: Line 13 Smooth-Model Data. 67
Appendix N: Line 14 Smooth-Model Data. 69
Appendix O: Line 15 Smooth-Model Data. 72
Appendix P: Line 16 Smooth-Model Data. 75
Figure
1. Peña de Hierro Field Area.
Figure
2. Peña de Hierro and Drill Site 1.
Figure
3. Field Working Conditions.
Figure
4. Typical Resistivities of Earth Materials.
Figure
5. Line 1 Fast-Turnoff TEM Data.
Figure
6. Line 3 Fast-Turnoff TEM Data.
Figure
7. Line 14 Fast-Turnoff TEM Data.
Figure
8. Line 15 Fast-Turnoff TEM Data.
Figure
9. Line 2 Fast-Turnoff TEM Data.
Figure
10. Line 5 Fast-Turnoff TEM Data.
Figure
11. Line 6 Fast-Turnoff TEM Data.
Figure
12. Line 9 Fast-Turnoff TEM Data.
Figure
13. Line 10 Fast-Turnoff TEM Data.
Figure
14. Line 4 Fast-Turnoff TEM Data.
Figure
15. Line 7 Fast-Turnoff TEM Data.
Figure
16. Line 8 Fast-Turnoff TEM Data.
Figure
17. Line 16 Fast-Turnoff TEM Data.
Figure
18. Line 11 Fast-Turnoff TEM Data.
Figure
19. Line 12 Fast-Turnoff TEM Data.
Figure
20. Line 13 Fast-Turnoff TEM Data.
Figure
21. Map of Recommended Drill Site Relocations.
Figure
22. Drill Site 1 and Drill Site 2 Area, Recommended
Relocations.
Figure
23. Drill Site 4 Area, Recommended Relocation.
Figure
24. Drill Site 3 Area, Recommended Relocation.
Table
1. Rio Tinto Drill Sites and Calibration Points.
Table
2. Line 1 Location Data.
Table
3. Line 3 Location Data.
Table
4. Line 14 Location Data.
Table
5. Line 15 Location Data.
Table
6. Line 2 Location Data.
Table
7. Line 5 Location Data.
Table
8. Line 6 Location Data.
Table
9. Line 9 Location Data.
Table
10. Line 10 Location Data.
Table
11. Line 4 Location Data.
Table
12. Line 7 Location Data.
Table
13. Line 8 Location Data.
Table
14. Line 16 Location Data.
Table
15. Line 11 Location Data.
Table
16. Line 12 Location Data.
Table
17. Line 13 Location Data.
Table
18. Recommended Drill Site Relocations.
Figure A.1. Line 1, Station 20 Field Data and Model
Resistivity.
Figure A.2. Line 1, Station 60 Field Data and Model
Resistivity.
Figure A.3. Line 1, Station 100 Field Data and
Model Resistivity.
Figure A.4. Line 1, Station 140 Field Data and
Model Resistivity.
Figure A.5. Line 1, Station 180 Field Data and
Model Resistivity.
Figure B.1. Line 2, Station 20 Field Data and Model
Resistivity.
Figure B.2. Line 2, Station 60 Field Data and Model
Resistivity.
Figure B.3. Line 2, Station 100 Field Data and
Model Resistivity.
Figure B.4. Line 2, Station 140 Field Data and
Model Resistivity.
Figure B.5. Line 2, Station 180 Field Data and
Model Resistivity.
Figure B.6. Line 2, Station 220 Field Data and
Model Resistivity.
Figure B.7. Line 2, Station 260 Field Data and
Model Resistivity.
Figure C.1. Line 3, Station 20 Field Data and Model
Resistivity.
Figure C.2. Line 3, Station 60 Field Data and Model
Resistivity.
Figure C.3. Line 3, Station 100 Field Data and
Model Resistivity.
Figure C.4. Line 3, Station 140 Field Data and
Model Resistivity.
Figure C.5. Line 3, Station 180 Field Data and
Model Resistivity.
Figure D.1. Line 4, Station 20 Field Data and Model
Resistivity.
Figure D.2. Line 4, Station 60 Field Data and Model
Resistivity.
Figure D.3. Line 4, Station 100 Field Data and
Model Resistivity.
Figure D.4. Line 4, Station 140 Field Data and
Model Resistivity.
Figure D.5. Line 4, Station 180 Field Data and
Model Resistivity.
Figure D.6. Line 4, Station 220 Field Data and
Model Resistivity.
Figure D.7. Line 4, Station 260 Field Data and
Model Resistivity.
Figure D.8. Line 4, Station 300 Field Data and
Model Resistivity.
Figure D.9. Line 4, Station 340 Field Data and
Model Resistivity.
Figure D.10. Line 4, Station 380 Field Data and
Model Resistivity.
Figure E.1. Line 5, Station 20 Field Data and Model
Resistivity.
Figure E.2. Line 5, Station 60 Field Data and Model
Resistivity.
Figure E.3. Line 5, Station 100 Field Data and
Model Resistivity.
Figure E.4. Line 5, Station 140 Field Data and
Model Resistivity.
Figure E.5. Line 5, Station 180 Field Data and
Model Resistivity.
Figure E.6. Line 5, Station 220 Field Data and
Model Resistivity.
Figure E.7. Line 5, Station 260 Field Data and
Model Resistivity.
Figure F.1. Line 6, Station 20 Field Data and Model
Resistivity.
Figure F.2. Line 6, Station 60 Field Data and Model
Resistivity.
Figure F.3. Line 6, Station 100 Field Data and
Model Resistivity.
Figure F.4. Line 6, Station 140 Field Data and
Model Resistivity.
Figure G.1. Line 7, Station 20 Field Data and Model
Resistivity.
Figure G.2. Line 7, Station 60 Field Data and Model
Resistivity.
Figure G.3. Line 7, Station 100 Field Data and
Model Resistivity.
Figure H.1. Line 8, Station 20 Field Data and Model
Resistivity.
Figure H.2. Line 8, Station 60 Field Data and Model
Resistivity.
Figure H.3. Line 8, Station 100 Field Data and
Model Resistivity.
Figure I.1. Line 9, Station 10 Field Data and Model
Resistivity.
Figure I.2. Line 9, Station 30 Field Data and Model
Resistivity.
Figure I.3. Line 9, Station 50 Field Data and Model
Resistivity.
Figure I.4. Line 9, Station 70 Field Data and Model
Resistivity.
Figure I.5. Line 9, Station 90 Field Data and Model
Resistivity.
Figure I.6. Line 9, Station 110 Field Data and
Model Resistivity.
Figure I.7. Line 9, Station 130 Field Data and
Model Resistivity.
Figure I.8. Line 9, Station 150 Field Data and
Model Resistivity.
Figure J.1. Line 10, Station 10 Field Data and
Model Resistivity.
Figure J.2. Line 10, Station 30 Field Data and
Model Resistivity.
Figure K.1. Line 11, Station 10 Field Data and
Model Resistivity.
Figure K.2. Line 11, Station 30 Field Data and
Model Resistivity.
Figure K.3. Line 11, Station 50 Field Data and
Model Resistivity.
Figure L.1. Line 12, Station 10 Field Data and
Model Resistivity.
Figure L.2. Line 12, Station 30 Field Data and
Model Resistivity.
Figure L.3. Line 12, Station 50 Field Data and
Model Resistivity.
Figure M.1. Line 13, Station 10 Field Data and
Model Resistivity.
Figure M.2. Line 13, Station 30 Field Data and
Model Resistivity.
Figure M.3. Line 13, Station 50 Field Data and
Model Resistivity.
Figure M.4. Line 13, Station 70 Field Data and
Model Resistivity.
Figure N.1. Line 14, Station 10 Field Data and
Model Resistivity.
Figure N.2. Line 14, Station 30 Field Data and
Model Resistivity.
Figure N.3. Line 14, Station 50 Field Data and Model
Resistivity.
Figure N.4. Line 14, Station 70 Field Data and
Model Resistivity.
Figure N.5. Line 14, Station 90 Field Data and
Model Resistivity.
Figure O.1. Line 15, Station 10 Field Data and
Model Resistivity.
Figure O.2. Line 15, Station 30 Field Data and
Model Resistivity.
Figure O.3. Line 15, Station 50 Field Data and
Model Resistivity.
Figure O.4. Line 15, Station 70 Field Data and
Model Resistivity.
Figure O.5. Line 15, Station 90 Field Data and
Model Resistivity.
Figure O.6. Line 15, Station 110 Field Data and
Model Resistivity.
Figure P.1. Line 16, Station 10 Field Data and
Model Resistivity.
Figure P.2. Line 16, Station 30 Field Data and
Model Resistivity.
Figure P.3. Line 16, Station 50 Field Data and
Model Resistivity.
Figure P.4. Line 16, Station 70 Field Data and
Model Resistivity.
This report describes the outcome of a Fast-Turnoff Transient Electro-Magnetic (TEM) geophysical survey carried out in the Peña de Hierro (“Berg of Iron”) field area of the Mars Analog Research and Technology Experiment (MARTE). The MARTE Peña de Hierro field area is located between the towns of Rio Tinto and Nerva in the Andalucia region of Spain. It is about one hour drive West of the city of Sevilla, and also about one hour drive North of Huelva.
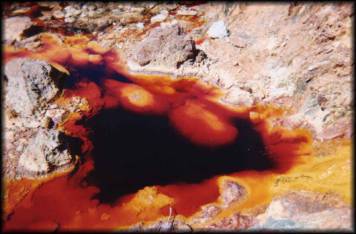
The high concentration of dissolved iron (and smaller amounts of other metals) in the very acidic water in the Rio Tinto area gives the water its characteristic wine red color, and also means that the water is highly conductive, and such an acidic and conductive fluid is highly suited for exploration by electromagnetic methods (Carlson et al., 2000, Zonge, 1992a, Zonge 1992b). This naturally acidic environment is maintained by bacteria in the groundwater and it is these bacteria that are the main focus of the MARTE project overall, and of this supporting geophysical work. It is the goal of this study to be able to map the subsurface extent of the high conductivity (low resistivity) levels, and thus by proxy the subsurface extent of the acidic groundwater and the bacteria populations. In so doing, the viability of using electromagnetic methods for mapping these subsurface metal-rich water bodies is also examined and demonstrated, and the geophysical data will serve to support drilling efforts.
The purpose of this field survey was an initial effort to map certain conductive features in the field area, in support of the drilling operations that are central to the MARTE project. These conductive features include the primary target of exploration for MARTE, the very conductive acidic groundwater in the area (which is extremely rich in metals). Other conductive features include the pyretic ore bodies in the area, as well as extensive mine tailings piles.
The Peña de Hierro field area is located within an area of extensive pyretic ore deposits, which have been mined extensively in the past. A majority of remaining natural topography consists of hills with relatively smooth and rounded tops that roll off into steeper sides and are intersected by narrow gullies with numerous small streams. There are few natural lakes of any size in the area, but a number of artificial lakes (dams). The original natural topography is widely modified by past mining activity, which stripped most of the hillsides in the field area, added mine tailings piles as an artificial topographic element, and also added several open mining pits.
Figure 1 shows a map of the field area, with a coarse geologic
map overlain on a topographic map. The general topography as outlined above is
illustrated in this map. The large area in geologic map marked in yellow is
mostly covered in mine tailings; the purple, roughly oval shape just North of
the center of the map is the lake in the open pit remaining from the mining
activity; and the band marked in light blue trailing roughly West-Northwest to
East-Southeast through the map is a shale unit. The steepness and extent of the
mine pit is apparent from the density and extent of the 20 m contour lines
surrounding the pit lake. The water in the pit lake is the very conductive
acidic groundwater common in the area, and has a dark wine-red color. Marked in
red on the map, just to the East and Southeast of the mine pit, is rust-red
rock unit (shale). Note also the artificial lake of relatively fresh water
behind the dam close to the Northwest corner of the map (marked in blue, with
horizontal hash marks), as well as the elongated lake holding acidic metal-rich
water near the Southwest corner of the map (marked in purple, again with
horizontal hash marks). The locations of the lines of geophysical soundings
collected in this survey are marked with thick red lines (▬, Lines 1, 3, 4, 5, 9, and 15) and thick
blue lines (▬, Lines 2, 6, 7, 8,
10, 11, 12, 13, 14, and 16). Drill site locations from the MARTE Drilling
Campaign Plan (Stoker et al., 2003a; Stoker et al., 2003b) are marked with
large red X’s, except for Drill Site
4 (located on the edge of the geologic map unit marked
in red), which is marked with a large yellow X. Recommended relocations of Drill Site
1, Drill Site
4, Drill Site
3, and Drill Site
2 (listed in order of recommended execution, more detail
in the
Summary and Recommendations section) are all marked with large green X’s.
Figure 1. Peña de Hierro Field Area.
Table 1 shows the drill site locations and elevations (GPS
coordinates) as given by the current MARTE Drilling Campaign Plan (Stoker et
al., 2003a; Stoker et al., 2003b). As described above, these drill sites are
also shown on Figure 1. Under
Summary and Recommendations, alternative locations for these drill sites
as recommended based on the geophysical survey are shown in Table 19, and the positions of both Drilling Campaign
locations and recommended (possible) relocations are shown in Figure 22. Figure 23 shows a blow-up of the area around Drill
Site 1 and Drill
Site 2 with planned locations and possible relocations for
that area. Figure 24 shows a similar map for the Drill Site 4 area, and Figure 25 shows the map of the Drill Site 3 area.
|
Waypoint |
Description |
Latitude |
Longitude |
Elevation |
|
SITE1 |
North 37.721083º |
West 6.555600º |
434 m |
|
|
SITE2A |
North 37.722367º |
West 6.552200º |
462 m |
|
|
SITE2B |
North 37.723417º |
West 6.552567º |
481 m |
|
|
SITE3 |
North 37.726350º |
West 6.559667º |
440 m |
|
|
SITE4 |
North 37.726650º |
West 6.553283º |
518 m |
|
|
SITE5 |
North 37.729550º |
West 6.552083º |
525 m |
|
|
DMBEND |
Dam bend, calibration point |
North 37.727533º |
West 6.561517º |
440 m |
|
RDBEND |
Road bend, calibration point |
North 37.729483º |
West 6.552133º |
537 m |
|
SOURCE |
Main source area, calibration point |
North 37.722100º |
West 6.551050º |
410 m |
Table 1. Rio Tinto Drill Sites and Calibration Points.
Drill site coordinates from Stoker et al. (2003a; 2003b);
calibration point coordinates collected using GPS as part of this tudy
Figure 2 shows images of the Peña de Hierro field area.
Figure
2a shows a view to the North-Northwest of the mine
tailings marked in yellow on the Figure 1 map, and Figure 2b shows a close-up of the Drill Site 1 location. Drill
Site 1 (as indicated in the Drilling Campaign Plan; Stoker et al., 2003a; Stoker et al., 2003b) is located next to the house
ruins in the image (behind the vehicle), and the photograph for Figure 2b was taken from roughly the location of the relocated
Drill
Site 1 (as discussed under Drill
Site 1 Recommendations; see also Table 1, Table 19, Figure 1, and Figure 23). Access to both the current plan location of Drill
Site 1 and to the (possibly) relocated Drill
Site 1 is quite convenient using the road seen in Figure 2b, which is also seen on the maps in Figure 1 and Figure 23.
Figure 2. Peña de Hierro and Drill Site 1.
Working conditions in the Peña de Hierro field are vary from relatively open and vehicle-accessible in the Drill Site 1, Drill Site 2, and Drill Site 3 areas (Figure 3a), to strictly walking-it-in in the areas of the source streams below the mine tailings (Figure 3c), along parts of Line 4 (Figure 3d), parts of
Line 16
and Line 8, and all of Line
7. Vegetation cover varies from non-existent in the Drill
Site 1, Drill
Site 2, and Drill
Site 3 areas (see Figure
3a again), to intermediate (Figure 3b and Figure
3c), to extremely dense (Figure 3d). Topography is quite variable (see Figure 1), but does not generally present an impossible
hindrance to the geophysical fieldwork.
Vegetation cover can have a dramatic
effect on productivity in the field. The spread at Station 140 on Line 5 (L05S04, shown in Figure
3a) took ~30
minutes to lay out and record, while the spread at Station 140 on Line 4 (L04S04, shown in Figure
3d) took ~1 hour, 35 minutes to lay out and record.
With some effort, the field crew can get the wires close enough to the ground
to achieve good data quality even in fairly dense vegetation cover (an
induction field method like TEM does not depend on ground contact of the
antennae for data quality). However, working in dense vegetation cover slows
the work down, and thus decreases the number of stations recorded per day. This
then also increases the overall cost of the survey, or decreases the total
number of stations recorded in a given number of field days.
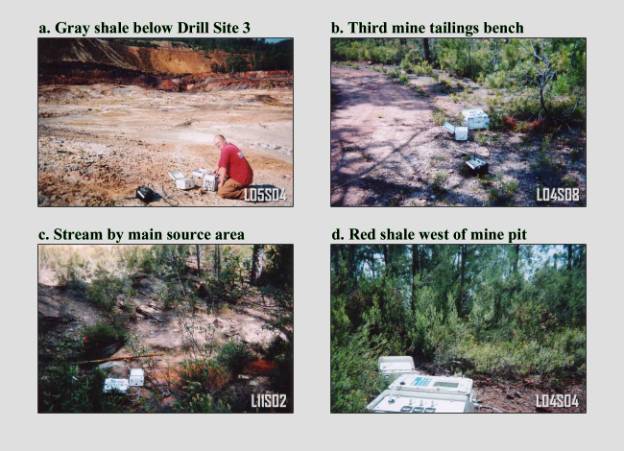
Figure 3. Field Working Conditions.
The Transient Electro-Magnetic (TEM) method, a.k.a. the Time-Domain Electro-Magnetic (TDEM) method has been used extensively for mapping of groundwater (Reynolds, 1997, p. 636, Zonge, 1992b), as well as mapping of metal-bearing weak acid solutions in mining leaching operations. The Controlled Source Audio-frequency Magneto-Telluric (CSAMT) method is an industry standard in mining exploration, and has also been used in the monitoring of leaching operations (Carlson et al., 2000, Zonge, 1992a, Reynolds, 1997, p. 666). The advantage of the CSAMT method in the mining environment is the narrow, linear footprint on the receiver side, which is of importance when operating along the benches of an open-pit mine. Logistically, the TEM method is somewhat simpler than the CSAMT method, and is a less costly alternative when the constraints of having to operate on the benches of an open-pit mine are not involved (Carlson et al., 2000, Zonge, 1992a, Zonge 1992b).
Fast-Turnoff TEM is a variation on TEM employing small wire loops as receiver antennae as well as transmitter antennae, and which uses analog/digital converter boards that have shorter delay times than regular a/d boards. The transmitters used in Fast-Turnoff TEM also have substantially shorter turnoff times than those used in conventional TEM, and the complete Fast-Turnoff TEM system allows for resolving features closer to the surface than possible with conventional TEM, meters or less versus tens of meters (Zonge, 2001). The trade-off made in using the Fast-Turnoff TEM method with an in-loop survey geometry is high sensitivity to shading effect (i.e., where very conductive layers causes deeper layers to appear more resistive than they really are). For mapping near-surface features, the thickness of mine tailings, and the like, Fast-Turnoff TEM presents a cost-effective alternative that should give acceptable data quality and very good productivity under most field conditions.
The Natural Source Audio-frequency Magneto-Telluric (NSAMT) method is an alternative to CSAMT that uses naturally occurring random noise as the source (atmospheric noise, telluric currents, distant lightning, etc.). NSAMT does not use an active source, and thereby does away with the costly and logistically more demanding transmitter and motor-generator setups required in CSAMT, while still producing similar resolution and depth of investigation (up to 2-3 km in practical situations, depending on the lowest sounding frequency used). What cause NSAMT station readings to take substantially more time than equivalent CSAMT readings, despite the nearly identical frequency bands and receiver electrode setups, is the low signal levels of naturally occurring electromagnetic noise, thus requiring substantially increased stacking of data in the field (Zonge, 1992a, Zonge, 2000). Thus, there is a certain trade-off between logistical complexity and raw productivity rate (in terms of spreads per day, say). On the whole, though, NSAMT fits a small budget much better than CSAMT. Compensating with longer workdays and fewer breaks can increase production rates.
It seems that the best trade-off of logistics, cost, and productivity is to use Fast-Turnoff TEM to resolve the near-surface portions of the subsurface in the mapping of the conductive fluids in the Rio Tinto area, combined with the NSAMT and conventional TEM methods for mapping deeper portions of the subsurface. For mapping deep water tables specifically, a combination of conventional TEM for intermediate depths (tens of meters to hundreds of meters) and NSAMT for intermediate and deeper depths (hundreds of meters and deeper) is the logical choice for a continued effort to provide geophysical support to the MARTE project.
For the initial subsurface mapping effort motivating this field study, the Fast-Turnoff TEM method does provide the best trade-off of cost, logistics, and ability to get the field survey organized and carried out in a timely fashion (there was a desire to get this data acquired and processed well in time for the planned drilling operations to take place in September 2003). Based on these considerations, the Fast-Turnoff TEM method was chosen for this field survey. Two survey geometries were used: one with 40 m by 40 m transmitter wire loops, and one with 20 m by 20 m transmitter wire loops, both using a central 10m by 10 m receiver wire loop. The trade-off in using a method and survey geometry somewhat sensitive to shading effects has proven worth taking in producing an initial picture of the subsurface in the Rio Tinto field area.
Processing of TEM data is fairly straight-forward. Parameters that need to be controlled are the transmitter ramp (in ms), transmitter length and width (20 m or 40 m in this study), transmitter moment (in m2), and receiver moment (in m2). Noise removal by careful inspection of the raw data (decay curves) is an important part of the process, and the part which involves the most human input. Data for station locations (x coordinate, y coordinate, elevations) and plotting parameters can be introduced into the processing chain by using parameter files.
Inversion of TEM data works by
minimizing the differences between apparent resistivities calculated from the
raw data to apparent resistivities calculated from a model representing real
earth resistivities. Apparent resistivity (![]() ) for TEM data is calculated as follows (Zonge, 1992b):
) for TEM data is calculated as follows (Zonge, 1992b):
where ![]() is transmitter
current in amperes,
is transmitter
current in amperes, ![]() is transmitter moment
in square meters,
is transmitter moment
in square meters, ![]() is receiver moment in
square meters,
is receiver moment in
square meters, ![]() is received voltage
in millivolts, and
is received voltage
in millivolts, and ![]() is time in
milliseconds.
is time in
milliseconds.
The
processing algorithm used to process the TEM data in this survey attempts to
simultaneously minimize three parameters (mathematically expressed as sums of
squared differences): The difference between observed and model apparent
resistivity; the difference between starting and inverted model parameters; and
inversion model roughness. The minimization scheme is an iterative process,
which ends when total error (![]() ) is reduced to (or below) a pre-defined maximum error
criterion. Total error (
) is reduced to (or below) a pre-defined maximum error
criterion. Total error (![]() ) is calculated as follows (MacInnes and Raymond, 1996):
) is calculated as follows (MacInnes and Raymond, 1996):
![]()
where ![]() is the data error
(difference between observed and model data, that is, apparent resistivity in
this case),
is the data error
(difference between observed and model data, that is, apparent resistivity in
this case), ![]() is the difference
between starting and inverted model parameters, and
is the difference
between starting and inverted model parameters, and ![]() is the number of
observed data values.
is the number of
observed data values. ![]() is calculated as
follows (MacInnes and Raymond, 1996):
is calculated as
follows (MacInnes and Raymond, 1996):
where ![]() is the observed log
apparent resistivity (
is the observed log
apparent resistivity (![]() ),
),![]() is the calculated model log apparent resistivity (
is the calculated model log apparent resistivity (![]() ), and
), and ![]() is the observed data
error.
is the observed data
error. ![]() is calculated as
follows (MacInnes and Raymond, 1996):
is calculated as
follows (MacInnes and Raymond, 1996):
where ![]() is the number of
stations in the inversion model,
is the number of
stations in the inversion model, ![]() is the number of
layers per station in the inversion model,
is the number of
layers per station in the inversion model, ![]() is the starting model
parameter (log resistivity),
is the starting model
parameter (log resistivity), ![]() is the inversion
model parameter (log resistivity) at iteration
is the inversion
model parameter (log resistivity) at iteration ![]() ,
, ![]() is the inversion model error (log resistivity),
is the inversion model error (log resistivity), ![]() is the relative
weight given to the starting model, and
is the relative
weight given to the starting model, and ![]() is the relative
weight given to the vertical smoothness constraint.
is the relative
weight given to the vertical smoothness constraint.
Interpretation of geophysical data such as that in this study depends greatly on geologic context. The interpretation is rarely the sole domain of the geophysicist, but involves integration of all available knowledge of the field area. For the Rio Tinto field area, the most important single document is probably the geologic map (see Figure 1),and thid forms the basis for any interpretation of the geophysical data.
An outline of the resistivities of typical Earth materials is shown in Figure 5. This data, combined with the geologic map shown in Figure 1 and conversations with MARTE team members more familiar with the Rio Tinto field area (mainly Carol Stoker and David Fernandez-Remolar), forms the basis for the simple first principle interpretations offered forth in this document. Further interpretation needs to involve MARTE team members with more knowledge of geology in general and of the Rio Tinto field area in particular.
Figure 5. Typical Resistivities of Earth Materials.
(Adapted from Palacky, 1987)
A total of 79 Fast-Turnoff TEM soundings were collected in this initial subsurface mapping effort, organized in 16 lines, 44 stations (Lines 1 through 8) using a 40 m x 40 m transmitter loop, and 35 stations (Lines 9 through 16) using a 20 m x 20 m transmitter loop. Both geometries employed a 10 m x 10 m receiver loop. Stations were named by their approximate distance in meters from the beginning of the line.
Five soundings with a ~40 m station spacing were collected to build Line 1, and the track of Line 1 is shown in red on the Figure 1 map. Line 1 is located in the Southeastern part of the mine tailings marked in yellow on the map in Figure 1. The first station on Line 1 (L01S01) is located 107 m from Drill Site 1 on a bearing of 88.9º (~East). Line 1 follows an average bearing of 44.7º (~Northeast), and is 200 m long (180 m from L01S01 to end of line). Table 2 shows the location (latitude, longitude, and elevation) of each station along Line 1, with each station labeled by its GPS waypoint name.
|
Waypoint |
Description |
Latitude |
Longitude |
Elevation |
|
Line 1, Station 20 |
North 37.721100º |
West 6.554383º |
439 m |
|
|
Line 1, Station 60 |
North 37.721400º |
West 6.554250º |
440 m |
|
|
Line 1, Station 100 |
North 37.721583º |
West 6.554017º |
438 m |
|
|
Line 1, Station 140 |
North 37.721833º |
West 6.553683º |
441 m |
|
|
Line 1, Station 180 |
North 37.721900º |
West 6.553450º |
451 m |
Table 2. Line 1 Location Data.
Figure
6a shows the raw data from Line 1, displayed as transient decay curves
(Volts/Amp), and Figure 6b shows a 1-D
smooth-model inversion of the Fast-Turnoff TEM data from Line 1. A
very conductive (resistivities of ~20 Ωm to less than 10 Ωm) surface
layer is visible in this section, with thickness varying from ~20 m under the
first two stations up to ~35 m under the third and forth stations. This would
be consistent with a make-up of the tailings consisting mostly of discarded
mined pyretic ore body rocks, mixed with shale fragments, and with water
flowing through the tailings. The sharp gradient (drop in resistivity) at the
~20-35 m depths is most likely the bedrock surface. Shading effects from the
very conductive surface layer mask the true resistivities of this bedrock
layer, and no conclusive statements can be made regarding the resistivity
structure of the layer.
a. Line 1 transient decay
curves b. Line
1 smooth-model cross-section

Figure 6. Line 1 Fast-Turnoff TEM Data.
The resistivity data from Line 1 is most useful in determining the thicknesses of the mine tailings along the cross-section. While a contribution to the high conductivity of the surface layer (mine tailings) from water content is likely, there are no clearly apparent crossings of channels or the like. The deepening of the surface layer under Station 140 (the fourth station) is possibly an oblique intersection of the conductive column under Station 180 and Station 220 of Line 2 (see Figure 10 and the discussion of Line 2 data), which is a possible crossing of water flow.
Five soundings with a ~40 m station spacing were collected to build Line 3 (similar to Line 1), and the track of Line 3 is shown in red on the Figure 1 map. Line 3 is located in the Southern part of the mine tailings marked in yellow on the map in Figure 1, to the Northeast and North of Drill Site 1. The first station on Line 3 (L03S01) is located 62 m from Drill Site 1 on a bearing of 53.2º (~Northeast). Line 3 follows an average bearing of 8.9º (~North), and is 200 m long (180 m from L03S01 to end of line). Table 3 shows the location (latitude, longitude, and elevation) of each station along Line 3, with each station labeled by its GPS waypoint name.
|
Waypoint |
Description |
Latitude |
Longitude |
Elevation |
|
Line 3, Station 20 |
North 37.721417º |
West 6.555033º |
441 m |
|
|
Line 3, Station 60 |
North 37.721817º |
West 6.555033º |
436 m |
|
|
Line 3, Station 100 |
North 37.722117º |
West 6.554967º |
442 m |
|
|
Line 3, Station 140 |
North 37.722467º |
West 6.554883º |
443 m |
|
|
Line 3, Station 180 |
North 37.722850º |
West 6.554867º |
446 m |
Table 3. Line 3 Location Data.
Figure
6a shows the raw data from Line 3, displayed as transient decay curves (Volts/Amp), and
Figure 6b shows a 1-D
smooth-model inversion of the Fast-Turnoff TEM data from Line 3. A very
conductive (resistivities of ~20 Ωm to less than 10 Ωm) surface
layer is visible in this section, similar in thickness to the layer under Line 3 shown in Figure 6b (thickness varying from ~20 m to ~35 m). This again would be consistent with a
make-up of the tailings consisting mostly of discarded mined pyretic ore body
rocks, mixed with shale fragments, and with water flowing through the tailings.
The sharp gradient (drop in resistivity) at the ~20-35 m depths is most likely
the bedrock surface. Shading effects from the very conductive surface layer
mask the true resistivities of this bedrock layer, but under Station 20 and Station 180 (first and fifth station) of Line 3 more
conductive (~150 Ωm) columns are apparent.
a. Line 3 transient decay
curves b.
Line 3 smooth-model cross-section

Figure 6. Line 3 Fast-Turnoff TEM Data.
The resistivity data from Line 3 is (like the Line 1 data) most useful in determining the thicknesses of the mine tailings along the cross-section. The conductive columns under Station 20 and Station 180 are possibly intersection of water flows similar to those seen in Line 2, and more prominently (more conductive) in the Line 14 and Line 15 cross-sections (Figure 7b and Figure 8b, respectively). Connecting these sub-tailings conductive features between Line 1, Line 3, Line 14, Line 15, and Line 2 would be somewhat speculative lacking denser spatial data coverage, but would be consistent with a direction of water flow at the base of the tailings in a generally South-Southwest direction in this area. This would also be consistent with the location of the source streams below Drill Site 1 (and Line 14/Line 15), including the one crossed by Line 13 (refer to Table 17 and Figure 20).
Like for Line 1 and Line 3, five soundings were collected to build Line 14, but this line was collected with a station spacing (and transmitter loop size) of 20 m. The track of Line 14 is shown in blue on the Figure 1 map (for contrast). Line 14 is located on the Southwestern edge of the mine tailings marked in yellow on the map in Figure 1, extending to the North-Northwest of Drill Site 1. The first station on Line 14 (L14S01) is co-located with Drill Site 1. Line 14 follows an average bearing of 339.2º (~North-Northwest), and is 100 m long (90 m from L14S01/Drill Site 1 to end of line). Table 4 shows the location (latitude, longitude, and elevation) of each station along Line 14, with each station labeled by its GPS waypoint name.
|
Waypoint |
Description |
Latitude |
Longitude |
Elevation |
|
Line 14, Station 10 |
North 37.721083º |
West 6.555600º |
430 m |
|
|
Line 14, Station 30 |
North 37.721217º |
West 6.555750º |
432 m |
|
|
Line 14, Station 50 |
North 37.721400º |
West 6.555867º |
430 m |
|
|
Line 14, Station 70 |
North 37.721517º |
West 6.556017º |
433 m |
|
|
Line 14, Station 90 |
North 37.721683º |
West 6.556117º |
425 m |
Table 4. Line 14 Location Data.
Figure
7a shows the raw data from Line 14, displayed as transient decay curves (Volts/Amp), and
Figure 7b shows a 1-D
smooth-model inversion of the Fast-Turnoff TEM data from Line 14. A very
conductive (resistivities of ~20 Ωm to less than 10 Ωm) surface
layer is visible in this section, similar in thickness to the layers under Line
1 (Figure 6b) and Line 3 (Figure 6b). Line
14 follows the
road that goes past Drill Site 1 to the North-Northwest, and reaches an outcrop of
dark red rock (shale). Notice that the conductive surface layer thins in this
direction under the last two stations along Line 14, consistent
with the layer of mine tailings tapering out against the rock outcrop.
Notice in Figure 7b the very conductive column under Station 30 (on the edge of the tailings, ~20 m from Drill Site 1). This feature has resistivities of less than 10
Ωm, and contrasts sharply with the more resistive bedrock surrounding it.
Referring to the map in Figure 1, the location of this feature projected to the
surface is consistent with an extension of the stream marked with a dashed
purple line on the map. This extension also correlates with the conductive
feature under Station 50 on Line 15 (see next section).
a. Line 14 transient decay
curves b. Line
14 smooth-model cross-section
Figure 7. Line 14 Fast-Turnoff TEM Data.
The resistivity data from Line 14 (and Line 15) indicate a conductive feature to the Northwest and North-Northwest of Drill Site 1. This conductive feature is unique within this dataset, in that it displays a conductivity contrast not seen elsewhere under the mine tailings. Its conductivity is high enough (resistivity low enough) that it more than overcomes the shading effects of the conductive mine tailings. This would be consistent with a flow of conductive groundwater contributing to making the cross-section in this location more conductive overall. Given that Line 14 runs right next to the edge of the tailings (as does the road in this area), relocating Drill Site 1 ~20 m along the 339.2º bearing may not provide a safe alternative, but the data from Line 15 (next section) may present a safer and logistically better alternative.
Six soundings were collected to build Line 15, with a station spacing (and transmitter loop size) of 20 m. The track of Line 15 is shown in red on the Figure 1 map. Line 15 extends to the North of Drill Site 1, near the Southwestern edge of the mine tailings marked in yellow on the map in Figure 1 (the back side of the transmitter loop wire for the first station was placed partially over the edge of the tailings). The first station on Line 15 (L15S01) is located 22 m from Drill Site 1 on a bearing of 306.5º (~Northwest). Line 15 follows an average bearing of 7.3º (~North), and is 120 m long (110 m from L15S01 to end of line). Table 5 shows the location (latitude, longitude, and elevation) of each station along Line 15, with each station labeled by its GPS waypoint name.
|
Waypoint |
Description |
Latitude |
Longitude |
Elevation |
|
Line 15, Station 10 |
North 37.721200º |
West 6.555800º |
432 m |
|
|
Line 15, Station 30 |
North 37.721383º |
West 6.555817º |
431 m |
|
|
Line 15, Station 50 |
North 37.721533º |
West 6.555867º |
425 m |
|
|
Line 15, Station 70 |
North 37.721717º |
West 6.555817º |
434 m |
|
|
Line 15, Station 90 |
North 37.721900º |
West 6.555750º |
436 m |
|
|
Line 15, Station 110 |
North 37.722083º |
West 6.555750º |
438 m |
Table 5. Line 15 Location Data.
Figure
8a shows the raw data from Line 15, and Figure
8b shows a 1-D
smooth-model inversion of the Fast-Turnoff TEM data from Line 15. The very
conductive surface layer discussed in detail in the three previous sections is
visible under the first two stations. Notice that the conductive surface layer
thins to the north along Line
15, as the line
runs along and partially on the outcrop of dark red rock (shale).
Notice in Figure 8b the very conductive oval-shaped feature under Station 50 (~55m from Drill Site 1 on a bearing of 334.9º). This feature has resistivities of less than 10 Ωm, and contrasts
with the more resistive bedrock (shale) surrounding it. Referring to the map in
Figure 1 and to the discussion of Line 14 data, the location of this feature projected to the
surface is consistent with an extension of the stream marked with a dashed
purple line on the map, and with the location of the very conductive feature
under Station 30 of Line 14. This channel-like feature is possibly a crossing of
a water flow.
a. Line 15 transient decay
curves b. Line
15 smooth-model cross-section

Figure 8. Line 15 Fast-Turnoff TEM Data.
The
resistivity data from Line 15 indicate a conductive feature to the Northwest and
North-Northwest of Drill
Site 1. As discussed in the previous section, this feature
is unique within this dataset, in that it displays a conductivity contrast not
seen elsewhere under the mine tailings. Again, this would be consistent with a
flow of conductive groundwater contributing to making the cross-section in this
location more conductive overall. Station 50 of Line
15 is located 55m
from Drill Site 1 on a bearing of 334.9º, just across the road
from the drill site. A fairly wide open flat area is located next to this
station, and would provide a
safer and logistically better alternative than that presented by the Station
30 of Line 14 location.
A location ~53 m from Drill Site 1 on a bearing of 335.5º provides an easily
accessible area suitable for placing heavy equipment, and right above the
conductive feature shown in Figure
8b. This location presents an alternative for relocation of Drill Site 1. For further detail on this recommendation,
refer to the Drill Site 1 sub-section under
Summary and Recommendations
(see Table 19, Figure
22, Figure
23).
Seven soundings were collected to build Line 2, with a station spacing (and transmitter loop size) of 40 m. The track of Line 2 is shown in blue (for contrast) on the Figure 1 map. Line 2 extends roughly Northwest to Southeast through the center of the mine tailings marked in yellow on the map in Figure 1 (the first station is located to the Southeast of the collection of several buildings in the center of the map). The first station on Line 2 (L02S01) is located 220 m from the alternative location Drill Site 2b on a bearing of 270.0º (due West). Line 2 follows an average bearing of 141.1º (~Southeast), and is 280 m long (260 m from L02S01 to end of line). Table 6 shows the location (latitude, longitude, and elevation) of each station along Line 2, with each station labeled by its GPS waypoint name.
|
Waypoint |
Description |
Latitude |
Longitude |
Elevation |
|
Line 2, Station 20 |
North 37.723417º |
West 6.555067º |
442 m |
|
|
Line 2, Station 60 |
North 37.723000º |
West 6.554817º |
442 m |
|
|
Line 2, Station 100 |
North 37.722783º |
West 6.554567º |
439 m |
|
|
Line 2, Station 140 |
North 37.722450º |
West 6.554367º |
441 m |
|
|
Line 2, Station 180 |
North 37.722167º |
West 6.553983º |
440 m |
|
|
Line 2, Station 220 |
North 37.721917º |
West 6.553717º |
443 m |
|
|
Line 2, Station 260 |
North 37.721767º |
West 6.553283º |
444 m |
Table 6. Line 2 Location Data.
Figure
10a shows the raw data from Line 2, and Figure
10b shows a 1-D
smooth-model inversion of the Fast-Turnoff TEM data from Line 2. The
conductive surface layer shown in the data from Line 1 (Figure 6b) and Line 3 (Figure 6b) is also present in the data from Line 2. In the Line 2 data the
layer is somewhat thinner than evidenced in Line 1 and Line 3 data, with thickness ranging from ~10 m to ~20 m.
This is consistent with the fact that Line
2 runs closer
to the Peña de Hierro hillside, where the mine tailings start tapering
off against the underlying topography. The
sharp gradient (drop in resistivity) at the ~10-20 m depths is most likely the
bedrock surface. Shading effects from the very conductive surface layer are still
apparent in much of this cross-section, but a large conductive high is shown under
Station 180 and Station 220 of Line 2 (~70-80
Ωm, Figure 10b). A smaller and somewhat weaker conductive feature
is apparent under Station 100 (~100-150 Ωm).
a. Line 2 transient decay
curves b. Line
2 smooth-model cross-section

Figure 10. Line 2 Fast-Turnoff TEM Data.
The resistivity data from Line 2 is (like the Line 1 and Line 3 data) perhaps most useful in determining the thickness of the mine tailings along the cross-section. The conductive high under Station 180 and Station 220 is possibly an intersection of water flow similar to the weaker conductive feature seen below Station 180 in the Line 3 data (Figure 6b). As mentioned above, it also appears that Station 180 of Line 1 may intersect this feature obliquely.
A location ~146 m from Drill Site 2a on a bearing of 254.5º, and ~190 m from Drill Site
2b on a bearing of 214.9º, provides an easily accessible area suitable for
placing heavy equipment, located above the conductive feature shown in Figure 10b. This location presents an alternative for
relocation of Drill Site 2. However, strong shading effects are present in much
of the data from the lines located on top of the tailings (Line 1, Line 2, Line 3, last five stations along Line 4). This means that inferences made based on
interpretations of data from within the Drill
Site 2 area are inconclusive. For further detail on this
recommendation, refer to the Drill Site 2 sub-section under
Summary and Recommendations.
Seven soundings with a ~40 m station spacing were collected to build Line 5, and the track of Line 5 is shown in red on the Figure 1 map. Line 5 is located on the large open shale surface Southeast of the dam and lake in the Northwest corner area of the field map. The first station on Line 5 (L05S01) is located 173 m from Drill Site 3 on a bearing of 231.7º (~Southwest). Line 5 follows an average bearing of 102.9º (~East), and is 280 m long (260 m from L05S01 to end of line). Table 7 shows the location (latitude, longitude, and elevation) of each station along Line 5, with each station labeled by its GPS waypoint name.
|
Waypoint |
Description |
Latitude |
Longitude |
Elevation |
|
Line 5, Station 20 |
North 37.725383º |
West 6.561200º |
447 m |
|
|
Line 5, Station 60 |
North 37.725567º |
West 6.560550º |
427 m |
|
|
Line 5, Station 100 |
North 37.725533º |
West 6.560250º |
427 m |
|
|
Line 5, Station 140 |
North 37.725467º |
West 6.559683º |
415 m |
|
|
Line 5, Station 180 |
North 37.725433º |
West 6.559317º |
421 m |
|
|
Line 5, Station 220 |
North 37.725333º |
West 6.558767º |
428 m |
|
|
Line 5, Station 260 |
North 37.725233º |
West 6.558683º |
428 m |
Table 7. Line 5 Location Data.
Figure
10a shows the raw data from Line 5, and Figure
10b shows a 1-D
smooth-model inversion of the Fast-Turnoff TEM data from Line 5. A very
conductive (resistivities of ~20 Ωm to less than 10 Ωm) surface
layer is visible in this section, with a thickness of ~15 m. Line 5 extends
across a large open area below Drill
Site 3, paralleling the red shale bench on which the drill
site is located. Several streams carrying the dark red conductive waters cross
this surface, and the surface itself is solid gray shale.
Notice in Figure 10b the very conductive channel-like feature under Station 140 (L05S04, ~98 m from Drill
Site 3 on a bearing of 180.9º). This feature
has resistivities of about 20 Ωm, and contrasts sharply with the more
resistive bedrock surrounding it. The location of this feature projected to the
surface is roughly consistent with streams observed on the surface of the large
shaly area (see Figure 3a).
a. Line 5 transient decay
curves b. Line
5 smooth-model cross-section

Figure 10. Line 5 Fast-Turnoff TEM Data.
The resistivity data from Line 5 is strongly influenced by shading effects caused by the very conductive surface layer. However, the very conductive feature under Station 140 seems to overcome this shading effect, and could present an interesting target for drilling.
A location ~98 m from Drill
Site 3 on a bearing of 180.9º provides an easily accessible area suitable for placing
heavy equipment, located above the conductive feature shown in Figure 10b. This location presents an alternative for
relocation of Drill Site 3. For further detail on this recommendation, refer to
the Drill Site 3 sub-section under
Summary and Recommendations.
Four soundings with a ~40 m station spacing were collected to build Line 6, and the track of Line 6 is shown in blue on the Figure 1 map. Line 6 is located on the large open shale surface Southeast of the dam and lake in the Northwest corner area of the field map, and crosses Line 5 at L05S04 (L06S02 is 9 m due South of L05S04). The first station on Line 6 (L06S01) is located 133 m from Drill Site 3 on a bearing of 192.7º (~South). Line 6 follows an average bearing of 47.4º (~Northeast), and is 160 m long (140 m from L06S01 to end of line). Table 8 shows the location (latitude, longitude, and elevation) of each station along Line 6, with each station labeled by its GPS waypoint name.
|
Waypoint |
Description |
Latitude |
Longitude |
Elevation |
|
Line 6, Station 20 |
North 37.725183º |
West 6.560000º |
431 m |
|
|
Line 6, Station 60 |
North 37.725383º |
West 6.559683º |
424 m |
|
|
Line 6, Station 100 |
North 37.725617º |
West 6.559333º |
420 m |
|
|
Line 6, Station 140 |
North 37.725883º |
West 6.559067º |
421 m |
Table 8. Line 6 Location Data.
Figure
11a shows the raw data from Line 6, and Figure
11b shows a 1-D
smooth-model inversion of the Fast-Turnoff TEM data from Line 6. A very
conductive (resistivities of ~20 Ωm to less than 10 Ωm) surface
layer is visible in this section, as in the Line 5 data described above, with a thickness of ~15 m. Line 6 extends
across a large open area below Drill
Site 3, starting near the road at the Southern edge of this
area, and going North towards the red shale bench on which the drill site is
located. Several streams carrying the dark red conductive waters cross this
surface, and the surface itself is solid gray shale (as described in the Line
5 section)
Notice in Figure
11b the thickening of the very conductive surface layer
from Station 100 (L06S03) to Station 140 (L06S04), into a nearly channel-like feature. The location of
this feature projected to the surface is consistent with an oblique intersection
of streams observed on the surface of the large shaly area (see Figure 1, Figure 3a).
a. Line 6 transient decay
curves b. Line
6 smooth-model cross-section

Figure 11. Line 6 Fast-Turnoff TEM Data.
Eight soundings with a ~20 m station spacing were collected to build Line 9, and the track of Line 9 is shown in red on the Figure 1 map. Line 9 is located on the red shale bench Southeast of the dam and lake in the Northwest corner area of the field map, and crosses Line 10 at L10S02 (L09S05 is 8 m from L10S02 on a bearing of 148.4º). The first station on Line 9 (L09S01) is located 36 m from Drill Site 3 on a bearing of 276º (~West). Line 9 follows an average bearing of 92.4º (~East), and is 160 m long (150 m from L09S01 to end of line). Table 9 shows the location (latitude, longitude, and elevation) of each station along Line 9, with each station labeled by its GPS waypoint name.
|
Waypoint |
Description |
Latitude |
Longitude |
Elevation |
|
Line 9, Station 10 |
North 37.726383º |
West 6.560067º |
441 m |
|
|
Line 9, Station 30 |
North 37.726367º |
West 6.559800º |
441 m |
|
|
Line 9, Station 50 |
North 37.726367º |
West 6.559583º |
436 m |
|
|
Line 9, Station 70 |
North 37.726367º |
West 6.559350º |
433 m |
|
|
Line 9, Station 90 |
North 37.726350º |
West 6.559067º |
439 m |
|
|
Line 9, Station 110 |
North 37.726300º |
West 6.558883º |
430 m |
|
|
Line 9, Station 130 |
North 37.726183º |
West 6.558700º |
433 m |
|
|
Line 9, Station 150 |
North 37.726067º |
West 6.558533º |
441 m |
Table 9. Line 9 Location Data.
Figure
12a shows the raw data from Line 9, and Figure
12b shows a 1-D
smooth-model inversion of the Fast-Turnoff TEM data from Line 9. A very
conductive (resistivities of ~20 Ωm to less than 10 Ωm) surface
layer is visible in this section, as in the Line 5 and Line
6 data
described above, with a thickness of ~15 m under the first four stations. Line 9 extends along
the red shale bench on which Drill
Site 3 is located (according to the Drilling Campaign Plan;
Stoker et al., 2003a; Stoker et al., 2003b). Line 9 goes right through Drill
Site 3; Station 50 (L09S03) is located 8 m from Drill Site 3
on a bearing of 74.4º.
Notice in Figure
12b the
thickening of the very conductive surface layer from Station 90 (L09S05) to Station 150 (L09S08), reaching a thickness of ~60 m. Note also the
conductive column under Station 150. The location of these features projected to the
surface is consistent with the sources of the streams observed on the surface
of the large shaly area below the red shale bench(see Figure 1, Figure 3a), as discussed in the sections on the Line
5 and Line
6 data.
a. Line 9 transient decay
curves b. Line
9 smooth-model cross-section

Figure 12. Line 9 Fast-Turnoff TEM Data.
Just two soundings with a ~20 m station spacing were collected to build Line 10, and the track of Line 10 is shown in blue on the Figure 1 map. Line 10 is located on the red shale bench Southeast of the dam and lake in the Northwest corner area of the field map, and intersects Line 9 at L09S05 (L10S02 is 8 m from L09S05 on a bearing of 328.4º). The first station on Line 10 (L10S01) is located 66 m from Drill Site 3 on a bearing of 73.4º (~East-Northeast). Line 10 follows an average bearing of 238.9º (~West-Southwest), and is just 40 m long (30 m from L10S01 to end of line). Table 10 shows the location (latitude, longitude, and elevation) of the two stations on Line 10, with each station labeled by its GPS waypoint name.
|
Waypoint |
Description |
Latitude |
Longitude |
Elevation |
|
Line 10, Station 10 |
North 37.726517º |
West 6.558950º |
436 m |
|
|
Line 10, Station 30 |
North 37.726417º |
West 6.559117º |
430 m |
Table 10. Line 10 Location Data.
Figure
13a shows the raw data from Line 10, and Figure
13b shows a 1-D
smooth-model inversion of the Fast-Turnoff TEM data from Line 10. A very conductive
(resistivities of ~20 Ωm to less than 10 Ωm) surface layer is
visible in this section, as in the Line 5, Line
6, and Line
9 data
described above. This layer has a thickness of ~40 m under Station 10, thinning to ~20 m under Station 30 (near Line
9). Line 10 extends
across the red shale bench on which Drill
Site 3 is located, at its widest section.
a. Line 10 transient decay
curves b. Line
10 smooth-model cross-section

Figure 13. Line 10 Fast-Turnoff TEM Data.
Ten soundings were collected to build Line 4, with a station spacing (and transmitter loop size) of 40 m. The track of Line 4 is shown in red on the Figure 1 map. The first station on Line 4 (L04S01) is located 82 m from the Drill Site 4 on a bearing of 63.1º (~Northeast). Station 60 (the second sounding on the line) of Line 4 is nearly co-located with Drill Site 4 (11 m on a bearing of 78.5º). Station 60 and Drill Site 4 are also located on the fault line crossed by Line 4, which runs from North-Northwest to South-Southeast just to the East of the deep mining pit shown on the map (following an average bearing of 156.3º). This fault plane is vertical. Line 4 follows an average bearing of 181.5º (~South), and is a little over 400 m long (~380 m from L04S01 to end of line). Table 11 shows the location (latitude, longitude, and elevation) of each station along Line 4, with each station labeled by its GPS waypoint name.
|
Waypoint |
Description |
Latitude |
Longitude |
Elevation |
|
Line 4, Station 20 |
North 37.726983º |
West 6.552450º |
451 m |
|
|
Line 4, Station 60 |
North 37.726667º |
West 6.553167º |
518 m |
|
|
Line 4, Station 100 |
North 37.726400º |
West 6.553100º |
523 m |
|
|
Line 4, Station 140 |
North 37.725983º |
West 6.553100º |
520 m |
|
|
Line 4, Station 180 |
North 37.725700º |
West 6.553183º |
526 m |
|
|
Line 4, Station 220 |
North 37.724600º |
West 6.553167º |
518 m |
|
|
Line 4, Station 260 |
North 37.723933º |
West 6.553117º |
496 m |
|
|
Line 4, Station 300 |
North 37.722900º |
West 6.553700º |
497 m |
|
|
Line 4, Station 340 |
North 37.722700º |
West 6.552567º |
467 m |
|
|
Line 4, Station 380 |
North 37.722450º |
West 6.553300º |
457 m |
Table 11. Line 4 Location Data.
Figure 14a shows the raw data from Line 4, and Figure 14b shows a 1-D smooth-model inversion of the Fast-Turnoff TEM data from Line 4. The surface elevation of the very acidic and metal-rich pit lake (marked in purple on the Figure 1 map) is ~431 meters, and this is also roughly the elevation of the resistivity gradient seen under Station 20 in Figure 14b. It is possible that this decrease in resistivity (increase in conductivity) is due to an infusion of the very conductive pit lake water. Note also that there is a conductive high under Station 60, centered at an elevation just below 440 meters, and that this conductivity high is right in the fault plane. One possibility that would explain this conductivity high is a combination of water flowing in the fault plane coming in contact with the water infusing from the pit lake, and an uplift of the infusing conductive water. Note that the presence of the conductive surface under Station 20 and Station 60 is consistent with what is seen in the Line 7 data (next section).
Station 100, Station 140, and Station 180 are located on the red shale marked in red on the map, on top of the ridge to the East and Southeast of the pit lake. Station 220 through Station 380 are located on each of the five benches in the hillside, and the latter four of these are located on increasingly thick mine tailings. Notice here that the mine tailings are very conductive, and that there is a shadowing effect from this in the data below the ~20 m thick tailings layer.
a. Line 4 transient decay
curves b. Line
4 smooth-model cross-section

Figure 14. Line 4 Fast-Turnoff TEM Data.
A location ~11 m from Drill
Site 4 on a bearing of 70.1º provides an alternative
for relocation of Drill Site 4. This is right next to Station 60 on Line
4, and right above the conductive high under this
station. For further detail on this recommendation, refer to the Drill Site 4 sub-section under
Summary and Recommendations
(see Table 19, Figure
22, Figure
24).
Three soundings with a ~40 m station spacing were collected to build Line 7, and the track of Line 7 is shown in blue on the Figure 1 map. Line 7 runs parallel to and to the East of the fault line that goes through Drill Site 4, at a distance of ~30 m from the fault line (refer to Figure 1). This line crosses Line 4 at L04S02 (L07S02 is 22 m from L04S02 on a bearing of 38.5º, and 31 m from Drill Site 4 on a bearing of 49.8º). The first station on Line 7 (L07S01) is located 52 m from Drill Site 4 on a bearing of 11.5º (~North). Line 7 follows an average bearing of 160.6º (~Southeast), and is 120 m long (100 m from L07S01 to end of line). Table 12 shows the location (latitude, longitude, and elevation) of each of the three stations along Line 7, with each station labeled by its GPS waypoint name.
|
Waypoint |
Description |
Latitude |
Longitude |
Elevation |
|
Line 7, Station 20 |
North 37.727100º |
West 6.553167º |
527 m |
|
|
Line 7, Station 60 |
North 37.726817º |
West 6.553017º |
530 m |
|
|
Line 7, Station 100 |
North 37.726383º |
West 6.552800º |
518 m |
Table 12. Line 7 Location Data.
Figure 15a shows the raw data from Line 7, and Figure 15b shows a 1-D smooth-model inversion of the Fast-Turnoff TEM data from Line 7. The surface elevation of the very acidic and metal-rich pit lake (marked in purple on the Figure 1 map) is ~431 meters, and this is also roughly the elevation of the resistivity gradient seen under Station 100 in Figure 15b. Note also that this conductive high has an elevation of ~470 m under Station 60, and and elevation of ~460 m under Station 20. As discussed for the Line 4 data, it is possible that this decrease in resistivity (increase in conductivity) is due to an infusion of the very conductive pit lake water, or that it is the water table. The complex topography of the conductive high surface could possibly be explained by an interaction of conductive acid water intruding through the adjacent fault plane with the water table.
a. Line 7 transient decay
curves b. Line
7 smooth-model cross-section
Figure 15. Line 7 Fast-Turnoff TEM Data.
The data from Line 7 agrees well with the data from Line 4. The irregular shape of the conductive surface at 60-85 m depth in the Line 7 data is consistent with an oblique intersection of the elevated conductive feature under Station 60 on Line 4, which goes towards a greater depth under Station 20 on Line 4. The conductive high at 60-85 m depth in the Line 7 data corroborates the presence of a similar conductive high in the Line 4 data.
The recommended relocation of
Drill Site 4 introduced above under the discussion of Line 4 data is thus supported by what we see in the Line 7 data. For further detail on this recommendation,
refer to the Drill Site 4 sub-section under
Summary and Recommendations
(see Table 19, Figure
22, Figure
24).
Three soundings with a ~40 m station spacing were collected to build Line 8, and the track of Line 8 is shown in blue on the Figure 1 map. Line 8 is located to the Northwest of the pit lake (marked in purple on Figure 1). Station 20 (L08S01) on Line 8 is 367 m from Drill Site 5 on a bearing of 256.8º (~West), 348 m from Drill Site 4 on a bearing of 313.7º (~Northwest), and 414 m from Drill Site 3 on a bearing of 48.6º (~Northeast). Line 8 follows an average bearing of 245.8º (~Southwest), and is 120 m long (100 m from L08S01 to end of line). Table 13 shows the location (latitude, longitude, and elevation) of each of the three stations along Line 8, with each station labeled by its GPS waypoint name.
|
Waypoint |
Description |
Latitude |
Longitude |
Elevation |
|
Line 8, Station 20 |
North 37.728800º |
West 6.556133º |
517 m |
|
|
Line 8, Station 60 |
North 37.728650º |
West 6.556467º |
517 m |
|
|
Line 8, Station 100 |
North 37.728517º |
West 6.556850º |
518 m |
Table 13. Line 8 Location Data.
Figure 16a shows the raw data from Line 8, and Figure
16b shows a 1-D
smooth-model inversion of the Fast-Turnoff TEM data from Line 8. As is
clearly seen in Figure
16a, this data is very noisy, and Figure 16b only shows a conductive surface layer. Given the
shallow thickness of this conductive layer (~20 m), the high elevation of this
area above the surface of the pit lake (and by inference above the water
table), the position of Line 8 along a topographic high (refer to Figure 1), and the fact that the rock surface surrounding Line 8 is highly fractured, this has to be due to the
characteristics of the near-surface rocks. The conductive surface layer is
likely not related to water in any way.
a. Line 8 transient decay
curves b. Line
8 smooth-model cross-section

Figure 16. Line 8 Fast-Turnoff TEM Data.
Four soundings with a station spacing of ~20 m were collected to build
Line 16, and the track of
Line 16 is shown in blue on the Figure 1 map. The first station on
Line 16 (L16S01) is located 29 m from the Drill Site 5 on a bearing of 300.7º (~Northwest). Station 50 (the third sounding on the line) of
Line 16 is nearly co-located with Drill Site 5 (2 m on a bearing of 181.8º). Station 50 and Drill Site 5 are also located on the fault line crossed by
Line 16, which follows a bearing of 30º from an intersection with the fault line that runs through Drill Site 4 (refer to Line 4 discussion, and to Figure 1). This fault plane is vertical. There is also a small stream following the bottom of the gully where the fault line is located, and this stream flows through Drill Site 5 /
Line 16 Station 50.
Line 16 follows an average bearing of 147.6º (~Southeast), and is 80 m long (~60 m from L16S01 to end of line). Table 14 shows the location (latitude, longitude, and elevation) of each station along
Line 16, with each station labeled by its GPS waypoint name.
|
Waypoint |
Description |
Latitude |
Longitude |
Elevation |
|
Line 16, Station 10 |
North 37.729683º |
West 6.552367º |
542 m |
|
|
Line 16, Station 30 |
North 37.729583º |
West 6.552250º |
542 m |
|
|
Line 16, Station 50 |
North 37.729533º |
West 6.552083º |
540 m |
|
|
Line 16, Station 70 |
North 37.729317º |
West 6.552067º |
538 m |
Line 16 Location Data.
Figure 17a shows the raw data from
Line 16, and Figure 17b shows a 1-D smooth-model inversion of the Fast-Turnoff TEM data from
Line 16. As is clearly seen in Figure 17a, this data is very noisy, and Figure 17b mostly shows only a conductive surface layer of ~15 m thickness (similar to the Line 8 data). Notice the thickening of the conductive layer to ~40 m under
Line 16 Station 50 / Drill Site 5, to the bottom of the cross-section in that area. The most likely explanation for the thickening of the conductive layer under Station 50 is water from the small stream described above intruding into the subsurface, and possibly into the fault plane itself.
a. Line 16 transient decay
curves b. Line
16 smooth-model cross-section

Line 16 Fast-Turnoff TEM Data.
Due to the inconclusive nature of the
Line 16
and Line 8 data, no recommendations regarding Drill Site 5 based on this data can be made at this time without
further data gathering at the field site (using a different electromagnetic
method and/or survey geometry). For further detail on this recommendation,
refer to the Drill Site 5 sub-section under
Summary and Recommendations.
Three soundings with a ~20 m station spacing were collected to build Line 11, and the track of Line 11 is shown in blue on the Figure 1 map. Line 11 is located in the gully below the Southeastern edge of the mine tailings pile marked in yellow on Figure 1. Station 10 (L11S01) on Line 11 is located 95 m from Drill Site 2a on a bearing of 105.8º (~East). Line 11 follows an average bearing of 108.3º (~East-Southeast), and is 60 m long (50 m from L11S01 to end of line). This is also the location of one of the main source areas where water samples and surface measurements have been taken for the MARTE project. Station 30 (L11S02) on Line 11 is located 6 m due East of the intersection of the two streams (one flowing from under the mine tailings, the other flowing down the gully from a natural source) that is used as one of the three map projection calibration points in the mapping for this study. Table 16 shows the location (latitude, longitude, and elevation) of each of the three stations along Line 11, with each station labeled by its GPS waypoint name.
|
Waypoint |
Description |
Latitude |
Longitude |
Elevation |
|
Line 11, Station 10 |
North 37.722133º |
West 6.551167º |
410 m |
|
|
Line 11, Station 30 |
North 37.722100º |
West 6.550983º |
408 m |
|
|
Line 11, Station 50 |
North 37.722050º |
West 6.550700º |
408 m |
Table 16. Line 11 Location Data.
Figure 19a shows the raw data from Line 11, and Figure 19b shows a 1-D smooth-model inversion of the Fast-Turnoff TEM data from Line 11. As is clearly seen in Figure 19a, this data is very noisy, and Figure 19b mostly shows only a conductive surface layer of ~15 m thickness. Notice however, the thickening of the conductive layer to ~35 m going from Station 30 to Station 50, to the bottom of the cross-section in that area. The most likely explanation for the thickening of the conductive layer under Station 50 is water from the source streams described above intruding into the subsurface, and possibly into the fault plane itself. Referring to Figure 1 and the Drill Site 4 discussion, it can be seen that the fault line going through Drill Site 4 (on a bearing of 156.3º) also intersects Line 11 at Station 50. Station 50 is centered 5 m from the center of the fault line on a 66.3º bearing (the normal to the average trend of the fault line). This means that substantial portions of both the 10 m by 10 m receiver loop and the 20 m by 20 m transmitter loop at Station 50 were located right on top of the fault line.
a. Line 11 transient decay
curves b. Line 11 smooth-model cross-section
Figure 19. Line 11 Fast-Turnoff TEM Data.
Three soundings with a ~20 m station spacing were collected to build Line 12, and the track of Line 12 is shown in blue on the Figure 1 map. Line 12 is located in a gully with a stream below the Southern edge of the mine tailings marked in yellow on Figure 1. Station 10 (L12S01) on Line 12 is located 235 m from Drill Site 1 on a bearing of 96.3º (~East). Line 12 follows an average bearing of 61.5º (~Northeast), and is 60 m long (50 m from L12S01 to end of line). This is also the location of one of the source areas where water samples and surface measurements have been taken for the MARTE project. Table 17 shows the location (latitude, longitude, and elevation) of each of the three stations along Line 12, with each station labeled by its GPS waypoint name.
|
Waypoint |
Description |
Latitude |
Longitude |
Elevation |
|
Line 12, Station 10 |
North 37.720850º |
West 6.552950º |
397 m |
|
|
Line 12, Station 30 |
North 37.720967º |
West 6.552800º |
397 m |
|
|
Line 12, Station 50 |
North 37.721033º |
West 6.552583º |
410 m |
Table 17. Line 12 Location Data.
Figure 20a shows the raw data from Line 12, and Figure 20b shows a 1-D smooth-model inversion of the Fast-Turnoff TEM data from Line 12. A conductive surface layer of ~15 m thickness is apparent in Figure 20b, consistent with the source stream and wet, muddy surface in this area.
a. Line 12 transient decay
curves b. Line
12 smooth-model cross-section

Figure 20. Line 12 Fast-Turnoff TEM Data.
Four soundings with a ~20 m station spacing were collected to build Line 13, and the track of Line 13 is shown in blue on the Figure 1 map. Line 13 is located in a gully with a stream below the Southwestern edge of the mine tailings marked in yellow on Figure 1. Station 10 (L13S01) on Line 13 is located 65 m from Drill Site 1 on a bearing of 142.6º (~Southeast). Line 13 follows an average bearing of 97.3º (~East), and is 80 m long (70 m from L13S01 to end of line). This is also the location of one of the source areas where water samples and surface measurements have been taken for the MARTE project. Table 17 shows the location (latitude, longitude, and elevation) of each of the three stations along Line 13, with each station labeled by its GPS waypoint name.
|
Waypoint |
Description |
Latitude |
Longitude |
Elevation |
|
Line 13, Station 10 |
North 37.720617º |
West 6.555150º |
429 m |
|
|
Line 13, Station 30 |
North 37.720550º |
West 6.554950º |
429 m |
|
|
Line 13, Station 50 |
North 37.720567º |
West 6.554717º |
423 m |
|
|
Line 13, Station 70 |
North 37.720567º |
West 6.554517º |
422 m |
Table 17. Line 13 Location Data.
Figure 20a shows the raw data from Line 13, and Figure 20b shows a 1-D smooth-model inversion of the Fast-Turnoff TEM data from Line 13. A conductive surface layer of ~15 m thickness is apparent in Figure 20b, consistent with the source stream and wet, muddy surface in this area.
a. Line 13 transient decay
curves b. Line
13 smooth-model cross-section

Figure 20. Line 13 Fast-Turnoff TEM Data.
Based on the locations of conductive features in the Fast-Turnoff TEM data, relocations are recommended for Drill Site 1 and Drill Site 3, and possibly for Drill Site 2. Due to logistical concerns that take precedence over interpretations of the geophysical data, it is recommended that Drill Site 4 be drilled at its current Drilling Campaign Plan location.
Drill Site 1 should be drilled first, as it presents the best opportunity to drill into conductive features (interpreted to possibly be conductive groundwater) close to the surface. The next logical choice chronologically is Drill Site 4, where Line 4 and Line 7 data show conductive features at depth, and where there is an elevated conductive feature under the second station (Station 60) of Line 4, which is located very close to the fault line going through Drill Site 4.
Drill Site 3 should be drilled following Drill Site 1 and Drill Site 4, time and funds allowing. Due to the inconclusive data for the Drill Site 2 area, and its location on the for drilling operations challenging mine tailings, it is recommended that Drill Site 2 is not drilled. However, the recommended relocation of Drill Site 2 presents a logistically safer and simpler alternative than either Drill Site 2a or Drill Site 2b (in the Drilling Campaign Plan). Further data is needed for the Drill Site 5 area, and no recommendations are made based on the geophysical data regarding this drill site at this time. Overall, it is recommended that Drill Site 5 not be drilled during the September / October 2003 drilling campaign.
|
Waypoint |
Description |
Latitude Longitude |
Bearing
from Plan
Location |
Distance
from Plan
Location |
Elevation |
|
NEW_S1 |
Recommended |
N
37.721510º W 6.555848º |
335.5º |
52.98
m |
Unknown (L15S02: 431 m) |
|
NEW_S4 |
Recommended |
N
37.726676º W 6.553161º |
70.1º |
10.92
m |
Unknown (L04S02: 518 m) |
|
NEW_S3 |
Recommended |
N
37.725473º W 6.559679º |
180.9º |
98.26
m |
Unknown (L05S05: 421 m) |
|
NEW_S2 |
Recommended |
N
37.722011º W 6.553806º |
254.5º (2a) 214.9º (2b) |
146.05
m (2a) 189.79
m (2b) |
Unknown (L02S06: 443 m) |
Table 19. Recommended Drill Site Relocations.
Table 19 shows the location data for the recommended relocations of these drill sites. Refer to Figure 1 for the general locations within the field area of both current and recommended locations for these drill sites. Refer to Table 1 for the current locations of the drill sites (from the Drilling Campaign Plan; Stoker et al., 2003a; Stoker et al., 2003b). Figure 22 shows a map of drill site locations and recommended relocations, with the bearing and distance between the two marked by green lines. Note that the recommended relocation of Drill Site 4 is very small, and overlaps with the current plan location on this map.
Conductive features are widespread through the field area, and
chances of hitting conductive groundwater or pyretic ore body almost are good.
However, the recommended relocations bring all drill sites as close as possible
to subsurface conductive features. It should be noted that given the fairly
widespread shading effects apparent in this dataset, most of these conductive
features are actually even more conductive than they appear in the data (i.e.,
the resistivities seen in the cross-sections for conductive features below the
very conductive surface layers should be considered upper limits on the actual
natural resistivities of these features).
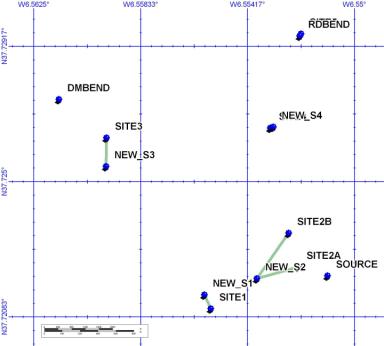
Figure 22. Map of Recommended Drill Site Relocations.
A location ~53 m from the Drilling
Campaign Plan location of Drill
Site 1 on a bearing of 335.5º provides an easily
accessible area suitable for placing heavy equipment, and right above the
conductive feature shown in Figure
8b. This location presents an alternative for
relocation of Drill Site 1. The coordinates for this proposed relocation of Drill Site 1 is shown in Table
19, Figure
22 shows the relationship between the plan location and
recommended relocation of Drill Site 1, and Figure
23 shows a close-up of the Drill Site 1 and Drill Site 2 area from the map in Figure 1.
The relocation of Drill Site 1 is supported by the data from Line 14 (Figure 7b) as well as by the data from Line
15 (Figure 8b), putting this drill site above a conductive feature
close to the surface. This location also provides a wide open area suitable
for placing a drill rig with associated heavy equipment. There is access to
this area by a gravel/rock road (wheel tracks) extending from the more heavily
trafficked road up onto the tailings plateau. Unlike the plan location for Drill Site 1, which would require equipment to be moved up over a
berm next to the road (see Figure 2b), there is no such berm on the North side of the
road.
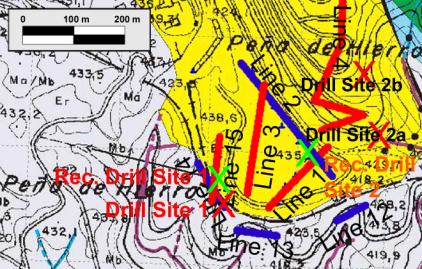
Figure 23. Drill Site 1 and Drill Site 2 Area, Recommended Relocations.
A location ~11 m from the Drilling Campaign Plan location of Drill Site 4 on a bearing of 70.1º provides an alternative for relocation of Drill Site 4. This is right next to Station 60 on Line 4, and would place Drill Site 4 above the conductive feature shown under this station in Figure 14b. The data from both Line 4 (Figure 14b) and Line 7 (Figure 15b) supports this relocation. An alternative would be to move Drill Site 4 further away from the fault line, towards Line 7, which shows a conductive high at depths of 60-85 m.
The coordinates for this
proposed relocation of Drill Site 4 (and the other drill sites) is shown in Table 19, while Figure
22 shows the relationship between the plan location and
recommended relocation of Drill Site 4. Figure
24 shows a close-up of the Drill Site 4 area from the map in Figure 1.
A big caveat in relocating Drill
Site 4 is the fact that the proposed relocation would require
equipment to be moved up and across a rocky berm roughly 50 cm in height,
probably even require some road building. This would greatly increase the cost
of the drilling operations, so despite the slight advantage in relocating Drill
Site 4 indicated by the geophysical data, it is recommended
in this report that Drill
Site 4 be drilled at the Drilling Campaign Plan location.
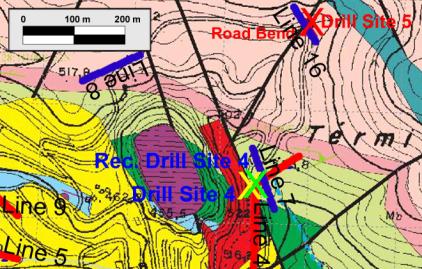
Figure 24. Drill Site 4 Area, Recommended Relocation.
A location ~98 m from the Drilling Campaign location of Drill Site 3 on a bearing of 180.9º provides an easily accessible area suitable for placing heavy equipment, located above the channel-like conductive feature under Station 140 on Line 5 (L05S04) shown in Figure 10b. This location presents an alternative for relocation of Drill Site 3. Line 6 also passes through this location, and Line 6 data supports the relocation. This drill site should be drilled following Drill Site 1 and Drill Site 4, time and funds allowing.
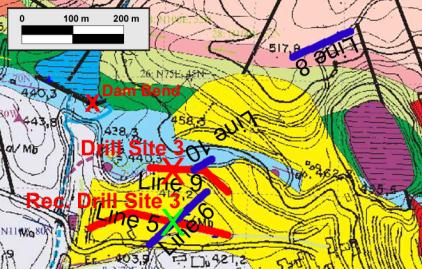
Figure 25. Drill Site 3 Area, Recommended Relocation.
Drill Site 3 is currently located on a red shale rock bench, which is accessible, but not large. The larger open rock surface to the South of the Drilling Campaign Plan location presents a more accessible alternative location for Drill Site 3. This area provides a large open area that should be convenient logistically, and quite safe operationally.
The coordinates for this proposed
relocation of Drill Site 3 is shown in Table
19, Figure
22 shows the relationship between the plan location and
recommended relocation of Drill Site 3, and Figure
25 shows a close-up of the Drill Site 3 area from the map in Figure 1.
A location ~146 m from the Drilling Campaign Plan Location of Drill Site 2a on a bearing of 254.5º, and ~190 m from Drill Site 2b on a bearing of 214.9º, provides an easily accessible area suitable for placing heavy equipment, located above the conductive feature under Station 220 and Station 180 on Line 2 (see Figure 10b). This location presents an alternative for relocation of Drill Site 2. This alternative Drill Site 2 is located 13 m from Line 2 Station 220 (L02S06) on a bearing of 322.9º.
The coordinates for this proposed
relocation of Drill Site 2 is shown in Table
19, Figure
22 shows the relationship between the plan location and
recommended relocation of Drill Site 2, and Figure
23 shows a close-up of the Drill Site 1 and Drill Site 2 area from the map in Figure 1.
Due to the inconclusive data for the Drill Site 2 area, and its location on the for drilling operations challenging mine tailings, it is recommended that Drill Site 2 is not drilled. The prevalent shading effects in the data from on top of the tailings pile (Line 1, Line 2, Line 3, parts of Line 4) also supports the recommendation to not drill at Drill Site 2. However, the recommended alternative relocation of Drill Site 2 presents a logistically safer and simpler alternative than either Drill Site 2a or Drill Site 2b (in the current Drilling Campaign Plan), should there be a need to drill in this area.
Data in the area of Drill Site 5 (
Line 16, Line 8) are inconclusive. No recommendations regarding Drill Site 5 based on this data can be made at this time without further data gathering at the field site (using a different electromagnetic method and/or survey geometry).
Given the fact that Drill Site 5 is more inaccessible than any of the other drill sites (the roads leading to this drill site are on the side of steep cliffs, very narrow, and washed out in places), it is recommended that Drill Site 5 not be drilled during the September / October 2003 drilling campaign.

Figure A.1. Line 1, Station 20 Field Data and Model Resistivity.
Figure A.2. Line 1, Station 60 Field Data and Model Resistivity.

Figure A.3. Line 1, Station 100 Field Data and Model Resistivity.

Figure A.4. Line 1, Station 140 Field Data and Model Resistivity.
Figure A.5. Line 1, Station 180 Field Data and Model Resistivity.

Figure B.1. Line 2, Station 20 Field Data and Model Resistivity.
Figure B.2. Line 2, Station 60 Field Data and Model Resistivity.

Figure B.3. Line 2, Station 100 Field Data and Model Resistivity.
Figure B.4. Line 2, Station 140 Field Data and Model Resistivity.
Figure B.5. Line 2, Station 180 Field Data and Model Resistivity.
Figure B.6. Line 2, Station 220 Field Data and Model Resistivity.
Figure B.7. Line 2, Station 260 Field Data and Model Resistivity.
Figure C.1. Line 3, Station 20 Field Data and Model Resistivity.
Figure C.2. Line 3, Station 60 Field Data and Model Resistivity.
Figure C.3. Line 3, Station 100 Field Data and Model Resistivity.
Figure C.4. Line 3, Station 140 Field Data and Model Resistivity.
Figure C.5. Line 3, Station 180 Field Data and Model Resistivity.
Figure D.1. Line 4, Station 20 Field Data and Model Resistivity.
Figure D.2. Line 4, Station 60 Field Data and Model Resistivity.
Figure D.3. Line 4, Station 100 Field Data and Model Resistivity.
Figure D.4. Line 4, Station 140 Field Data and Model Resistivity.
Figure D.5. Line 4, Station 180 Field Data and Model Resistivity.
Figure D.6. Line 4, Station 220 Field Data and Model Resistivity.
Figure D.7. Line 4, Station 260 Field Data and Model Resistivity.
Figure D.8. Line 4, Station 300 Field Data and Model Resistivity.
Figure D.9. Line 4, Station 340 Field Data and Model Resistivity.
Figure D.10. Line 4, Station 380 Field Data and Model Resistivity.

Figure E.1. Line 5, Station 20 Field Data and Model Resistivity.

Figure E.2. Line 5, Station 60 Field Data and Model Resistivity.
Figure E.3. Line 5, Station 100 Field Data and Model Resistivity.
Figure E.4. Line 5, Station 140 Field Data and Model Resistivity.

Figure E.5. Line 5, Station 180 Field Data and Model Resistivity.

Figure E.6. Line 5, Station 220 Field Data and Model Resistivity.
Figure E.7. Line 5, Station 260 Field Data and Model Resistivity.
Figure F.1. Line 6, Station 20 Field Data and Model Resistivity.
Figure F.2. Line 6, Station 60 Field Data and Model Resistivity.

Figure F.3. Line 6, Station 100 Field Data and Model Resistivity.

Figure F.4. Line 6, Station 140 Field Data and Model Resistivity.

Figure G.1. Line 7, Station 20 Field Data and Model Resistivity.

Figure G.2. Line 7, Station 60 Field Data and Model Resistivity.

Figure G.3. Line 7, Station 100 Field Data and Model Resistivity.
Figure H.1. Line 8, Station 20 Field Data and Model Resistivity.
Figure H.2. Line 8, Station 60 Field Data and Model Resistivity.
Figure H.3. Line 8, Station 100 Field Data and Model Resistivity.

Figure I.1. Line 9, Station 10 Field Data and Model Resistivity.
Figure I.2. Line 9, Station 30 Field Data and Model Resistivity.
Figure I.3. Line 9, Station 50 Field Data and Model Resistivity.

Figure I.4. Line 9, Station 70 Field Data and Model Resistivity.

Figure I.5. Line 9, Station 90 Field Data and Model Resistivity.
Figure I.6. Line 9, Station 110 Field Data and Model Resistivity.

Figure I.7. Line 9, Station 130 Field Data and Model Resistivity.
Figure I.8. Line 9, Station 150 Field Data and Model Resistivity.
Figure J.1. Line 10, Station 10 Field Data and Model Resistivity.
Figure J.2. Line 10, Station 30 Field Data and Model Resistivity.
Figure K.1. Line 11, Station 10 Field Data and Model Resistivity.
Figure K.2. Line 11, Station 30 Field Data and Model Resistivity.
Figure K.3. Line 11, Station 50 Field Data and Model Resistivity.
Figure L.1. Line 12, Station 10 Field Data and Model Resistivity.
Figure L.2. Line 12, Station 30 Field Data and Model Resistivity.
Figure L.3. Line 12, Station 50 Field Data and Model Resistivity.
Figure M.1. Line 13, Station 10 Field Data and Model Resistivity.
Figure M.2. Line 13, Station 30 Field Data and Model Resistivity.
Figure M.3. Line 13, Station 50 Field Data and Model Resistivity.
Figure M.4. Line 13, Station 70 Field Data and Model Resistivity.
Figure N.1. Line 14, Station 10 Field Data and Model Resistivity.
Figure N.2. Line 14, Station 30 Field Data and Model Resistivity.
Figure N.3. Line 14, Station 50 Field Data and Model Resistivity.

Figure N.4. Line 14, Station 70 Field Data and Model Resistivity.
Figure N.5. Line 14, Station 90 Field Data and Model Resistivity.
Figure O.1. Line 15, Station 10 Field Data and Model Resistivity.
Figure O.2. Line 15, Station 30 Field Data and Model Resistivity.
Figure O.3. Line 15, Station 50 Field Data and Model Resistivity.
Figure O.4. Line 15, Station 70 Field Data and Model Resistivity.
Figure O.5. Line 15, Station 90 Field Data and Model Resistivity.

Figure O.6. Line 15, Station 110 Field Data and Model Resistivity.
Figure P.1. Line 16, Station 10 Field Data and Model Resistivity.
Figure P.2. Line 16, Station 30 Field Data and Model Resistivity.
Figure P.3. Line 16, Station 50 Field Data and Model Resistivity.
Figure P.4. Line 16, Station 70 Field Data and Model Resistivity.
Carlson, N., Zonge, K., Ring, G., and Rex, M., “Fluid Flow Mapping at a Copper Leaching Operation in Arizona”. The Leading Edge, Vol. 19, No. 7, July 2000.
MacInnes, S., and Raymond, M., STEMINV Documentation, ZONGE Data Processing Smooth-Model TEM Inversion version 2.01. Zonge Engineering and Research Organization, Inc., Tucson, AZ, 1996.
Palacky, G. J., “Resistivity Characteristics of Geologic Targets”. In: Electromagnetic Methods in Applied Geophysics, Volume 1, Theory. Nabighian, M. N., editor. Society of Exploration Geophysicists, Series: Investigations in Geophysics, Volume 3. Tulsa, OK, 1987.
Reynolds, J. M., An Introduction to Applied and Environmental Geophysics. John Wiley & Sons Ltd., Chichester, England, 1997.
Stoker, C. R., Lemke, L., Mandell, H., McKay, D., George, J., Gomez-Alvera, J., Amils, R., Stevens, T., and Miller, D., “Drilling Campaign Plan V0.1”. MARTE working document, April 28, 2003a.
Stoker, C. R., Lemke, L., Mandell, H., McKay, D., George, J., Gomez-Alvera, J., Amils, R., Stevens, T., and Miller, D., “Drilling Plan CRS 4-20-2003”. MARTE working document, April 20, 2003b.
Stoker, C. R., Lemke, L., Mandell, H., McKay, D., George, J., Gomez-Alvera, J., Amils, R., Stevens, T., and Miller, D., “Mars Analog Research and Technology Experiment (MARTE): A Simulated Mars Drilling Mission to Search for Subsurface Life at the Rio Tinto, Spain”. Abstract No. 1076, 34.th Lunar and Planetary Science Conference, Houston, TX, March 17-21, 2003c.
Zonge, K. L., “Introduction to CSAMT”. In: Practical Geophysics II, for the Exploration Geologist. Van Blaricom, R., editor. Northwest Mining Assoc., Spokane, WA, 1992a.
Zonge, K. L., “Introduction to TEM”. In: Practical Geophysics II, for the Exploration Geologist. Van Blaricom, R., editor. Northwest Mining Assoc., Spokane, WA, 1992b.
Zonge, K. L., “NSAMT – Natural Source Audio-frequency Magnetotelluric Imaging”. Zonge Engineering and Research Organization, Inc., Tucson, AZ, 2000.
Zonge, K. L., “NanoTEM – A Very Fast-Turnoff TEM System”. Zonge Engineering and Research Organization, Inc., Tucson, AZ, 2001.
      |